Asset allocators view equity and bond valuations quite differently.
For bonds, they pay particular attention to starting yield because this is precisely the return they should receive if the investment is held until maturity.
On the other hand, for equities as an asset class, they seldom pay as much attention to the starting cash flow yield.
This article will briefly explore current cash flow yields in equities, the relationship with long-term returns and what past yields and returns may tell us about markets today.
The current cash flow yield on global developed equities is 9.6 per cent (as at December 2019). Does this mean investors should expect a return of 9.6 per cent a year? Not entirely.
Businesses cannot pay out every penny to shareholders, for obvious reasons, and there are other impacts on long-term cash flows, like inflation and growth.
On average, we find future returns are below the starting yield, but the starting yield remains highly indicative of future returns, as we show next.
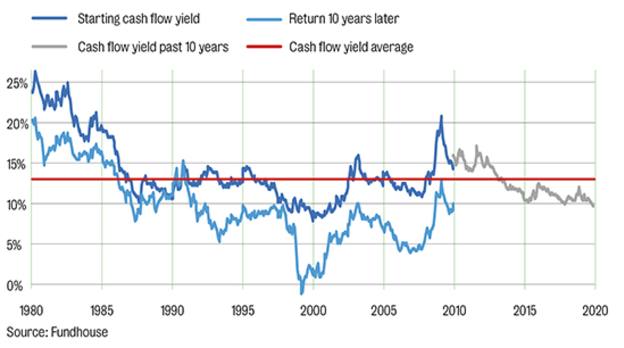
In the below graph, the starting cash flow yield of global developed equities is plotted alongside the return 10 years later. As mentioned, starting cash flow yield is almost always higher.
There are a few important observations to note.
The first is how closely related the two lines are.
There is a very positive correlation of 0.87 between the starting cash flow yield and return 10 years later.
This makes sense: when stock prices are low and yields are therefore high, future returns will increase (and vice versa).
The second observation to make is how high cash flow yields were in the early 1980s, explained mostly by it being a period of high inflation.
Throughout the 1990s and up to the present day, as global inflation has reduced and become more range-bound, we have seen cash flow yields stabilise at their long-term average range of 10 per cent to 15 per cent.
We also note how the lines start to significantly decouple around the time of the tech bubble in the late 1990s.
Cash flow yields had not dropped below 10 per cent since 1980, but this happened for a sustained period during this boom. Global equity cash flow yields bottomed at 8 per cent in late 1999.
It comes as no surprise therefore, given the strong relationship between starting cash flow yield and future returns, that the 10 years following the tech bubble produced the lowest 10-year returns for investors over the past 40 years.
And this was also the only period where global equity investors lost capital over a 10-year period.
Astonishingly, today’s cash flow yield for developed global equities at 9.6 per cent is at a level last seen only during the momentum markets of the late 1990s.
If we map the various 10-year returns received from developed equities at this sort of starting cash flow yield, we get an average of 3.6 per cent a year, with quite pronounced risks.


